2022 Baseline
You cannot manage what you do not measure. That may sound cliché to many, but it is reality. In early 2022, the Center for Dairy Excellence approached several financial institutions within Pennsylvania that have dairy benchmarking programs to see if there was interest in developing a state benchmarking program. These discussions evolved into a joint project between Horizon Farm Credit, Penn State Extension, and the Center for Dairy Excellence called “Pennsylvania Dairy Performance Indicators.” The Center facilitates the project while Horizon Farm Credit and Penn State Extension gather the data from their respective benchmarking programs. Together, they have combined the data into one larger, anonymous database and then analyzed the data to provide the key performance indicators. Pennsylvania dairy farm families and the industry representatives that support them can use these performance indicator averages to compare to their individual dairy performance against a “state” average. The dairy industry can also use this data to track progress over time.
Since different institutions sometimes calculate the same metric differently, the first step was to decide what key performance indicators were calculated similarly where a combined database would not be skewed by different calculations for the same metric. A committee consisting of representatives from each of the three organizations developed a list of 17 performance indicators, ranging from herd performance metrics to financial performance metrics. The goal of this project is to help dairy farm families and their industry representatives realize that they can measure this type of data and manage it to have a stronger Pennsylvania dairy industry.
17 Performance Indicators
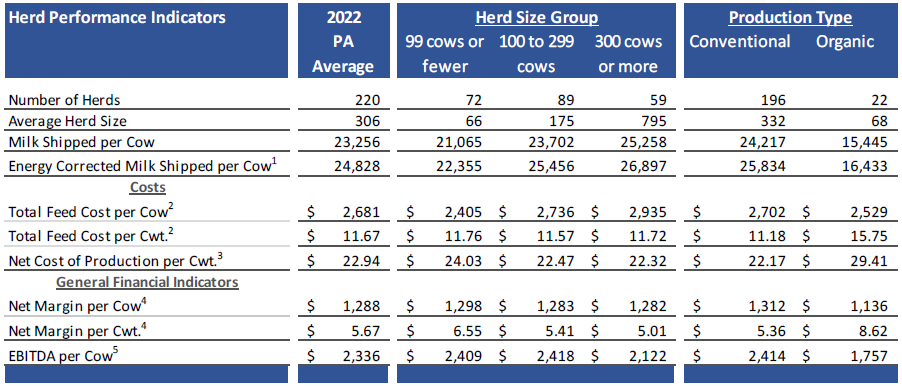
The report reviews 17 of the key performance indicators organized by herd size as well as conventional dairies and organic dairies. The indicators include:
- Average herd size
- Milk shipped per cow
- Energy corrected milk shipped per cow
- Total feed cost per cow
- Total feed cost per cwt.
- Net cost of production per cwt.
- Net margin per cow
- Net margin per cwt.
- EBITDA per cow (Accrual-based earning before tax, interest, and depreciation/amortization)
- Current ratio ratings
- Equity-to-asset ratio ratings
- Operating expense ratio ratings
- Debt to EBITDA ratio ratings

There are four indicators still under consideration. Some of the identified indicators are being monitored this year to evaluate calculations and comparability, specifically assets per cow, debt per cow, return on assets, and total revenue to total labor cost ratio. These metrics have several acceptable methods of valuation and calculation, and the committee continues to review results to determine what changes may be warranted to improve the ability to share those metrics in the future.

